How Data Helps Altoona School District Serve All Students
Looking at student data helped the district uncover areas for improvement and inspire quick action to ensure student subpopulations aren’t overlooked.
At a Glance:
- Location
- Altoona, WI
- K-12 Enrollment
- 1,861
- Teachers & Staff
- 162
Frontline Solutions Used:
- Student Analytics Lab
- Comparative Analytics
A Growing District, Accumulating Data
Just over 1,800 students attend Altoona School District, a small campus on the outskirts of Eau Claire, Wisconsin, but that number is growing rapidly. As enrollment climbs, monitoring student progress through spreadsheets and manually looking up data in the student information system grows more demanding.
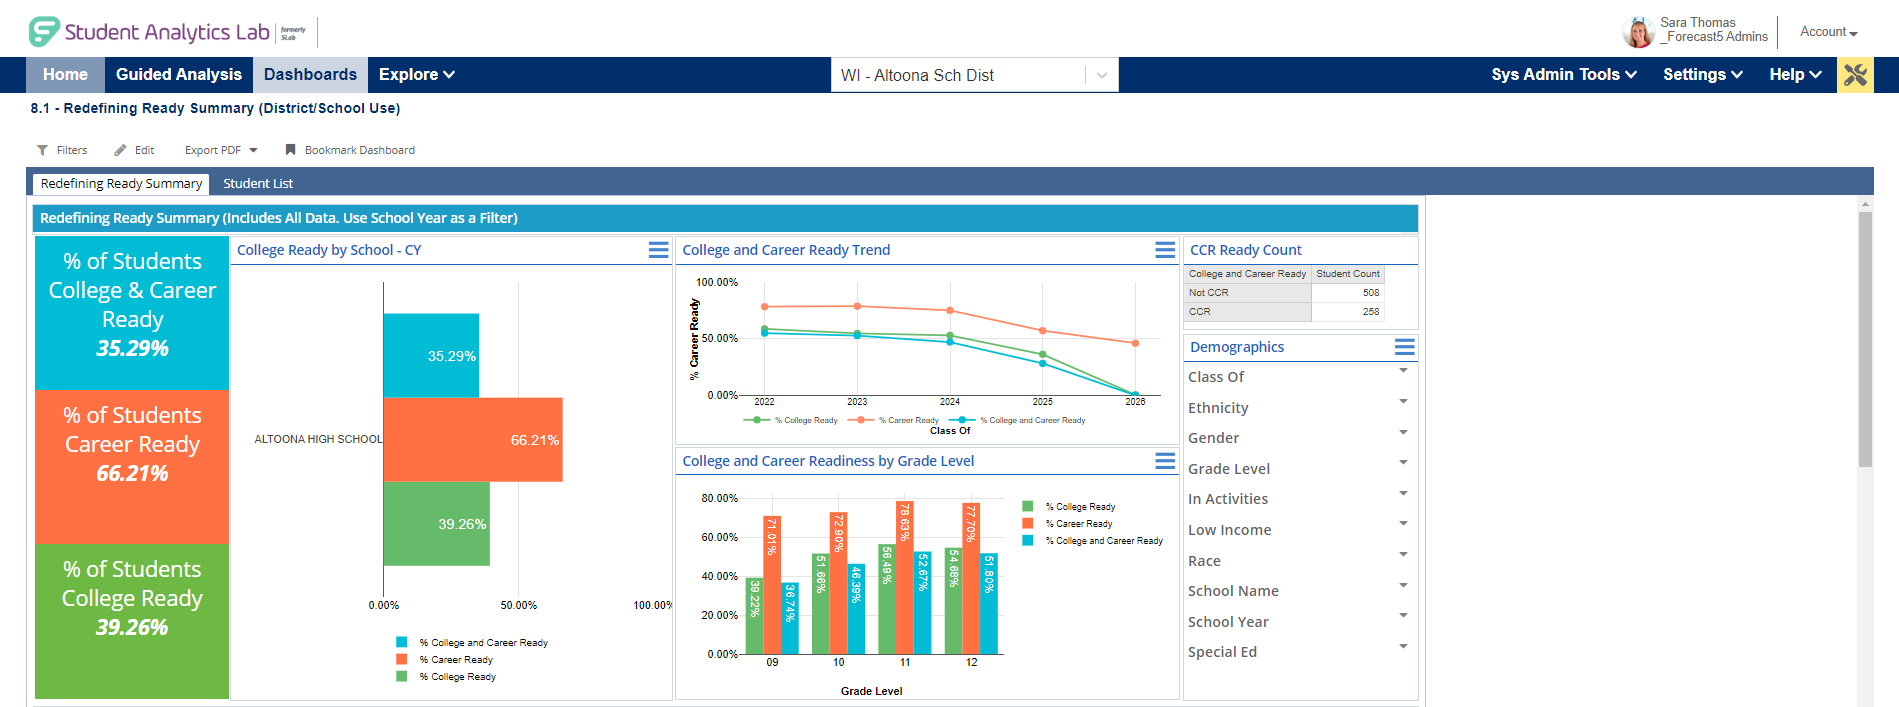
Sarah Radcliffe, Director of Future-Ready Learning, leads the district’s college and career readiness program. She said it was clear that they needed a better way to compile data to determine which students met the criteria for being college ready or career ready. For career readiness, that involves looking at nine different data points in the SIS. “You have to go student by student to say, ‘Did they have the GPA and one or more of the following areas?’ in order to be considered college ready. That kind of calculation takes a lot of time. It’s not looking at one measure, it’s looking at a combination of measures. To do that for every student, even with 140 graduates, takes a lot of time.” Even then, Sarah said, they were unable to see how certain groups of students, such as English Learners or students of a minority race, performed.
Dr. Heidi Eliopoulos, Superintendent at Altoona School District, relies on data to track the district’s progress over time — but knew she couldn’t devote hours each week to data entry. “The higher up you are in the organization, the more wasting time costs your organization, so you’re better off investing in efficiencies so that you can put your time into solving the problems instead of hand-gathering all the data.”
Heidi and Sarah had both used Frontline Analytics (formerly Forecast5 Analytics) at previous districts, and they knew it could help them not only be more efficient but also provide vital insights about district and student performance. They implemented Frontline’s Student Analytics Lab to aggregate student data from multiple sources and chose Comparative Analytics to enable them to see how Altoona performs — in terms of salaries and benefits as well as academic outcomes — compared to other area school districts. Both systems offer visual dashboards to make the data easier to understand.
“With that dashboard it’s all in one, it’s all there. I don’t have to calculate anything else. Other companies say that they’re doing it, but they’re not.”
Drilling into Student Subpopulations
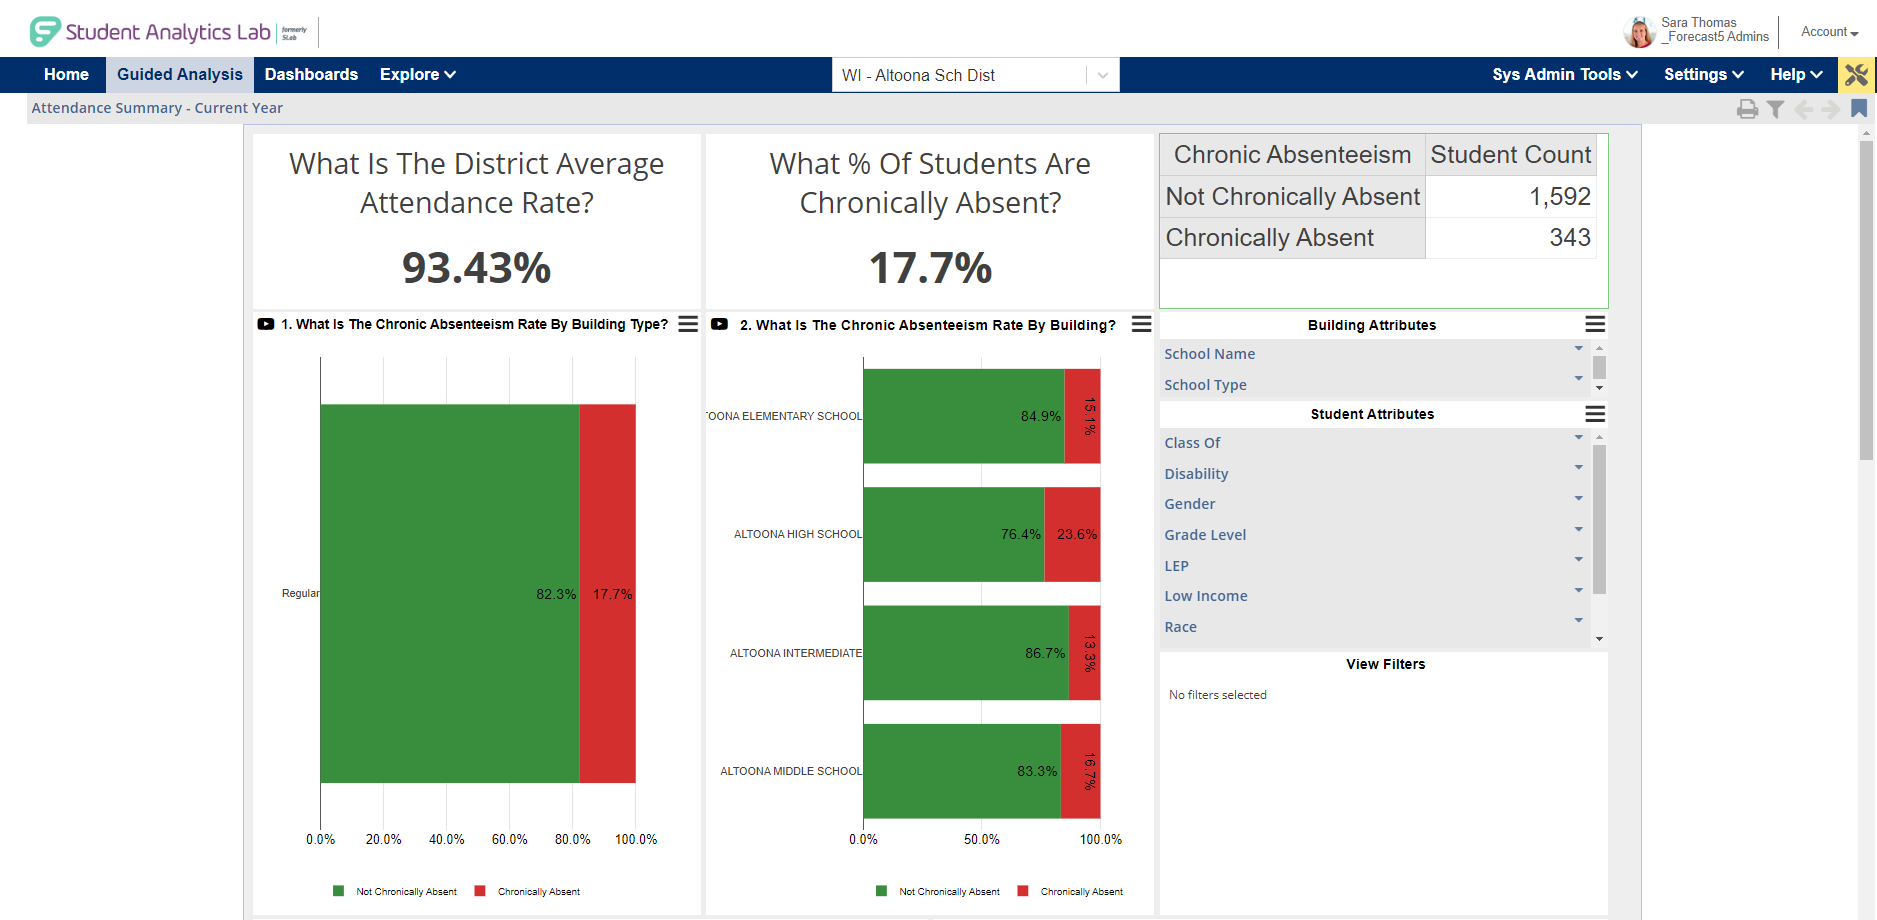
The analytics tools from Frontline let Heidi and Sarah look at specific student subpopulations, such as students in special education or those who live below the poverty line, and track performance compared to the district as a whole or how those groups performed on standardized tests compared with other districts. If other districts performed better, Heidi can reach out to them for ideas.
“I look at who’s around our size with a comparable free and reduced percentage, and who’s doing better. Because they’re a similar population, and if they’re getting better outcomes than we are, I want to know what they’re doing,” said Heidi. “Most districts are typically willing to tell their story, so we can learn from each other. There are things that are working in education and I like learning from other practitioners, and so I identify who I’m going to call when we’re stuck.”
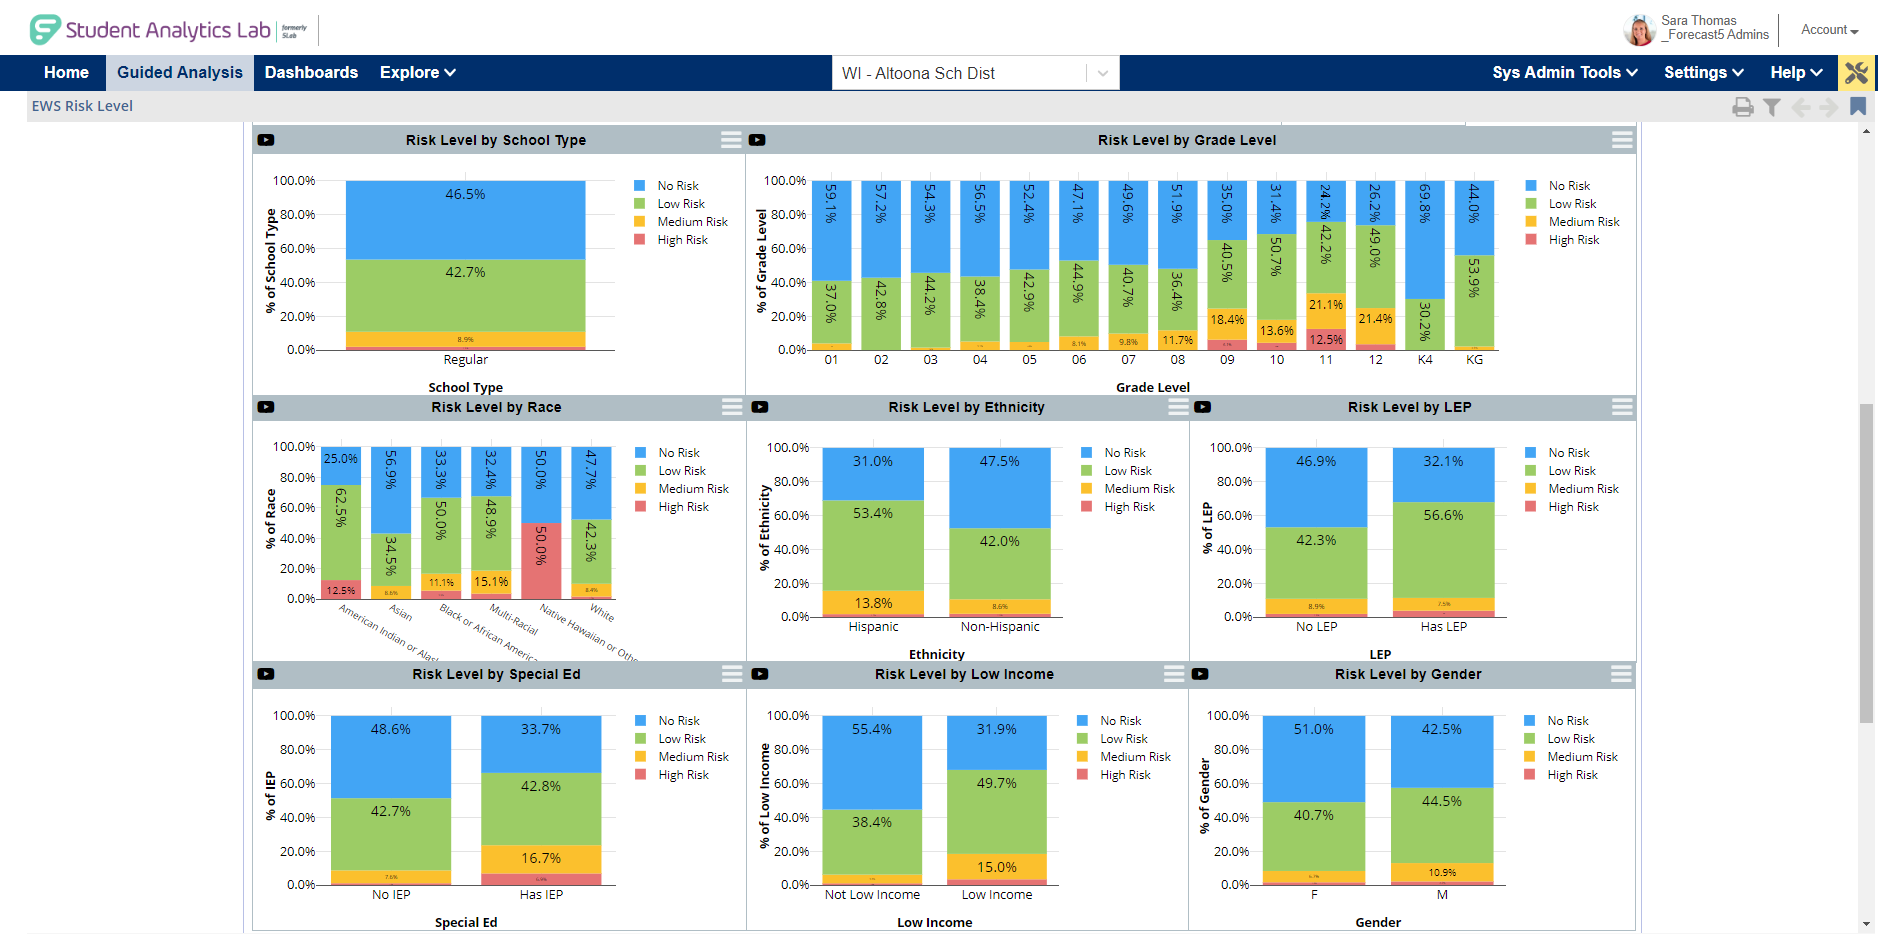
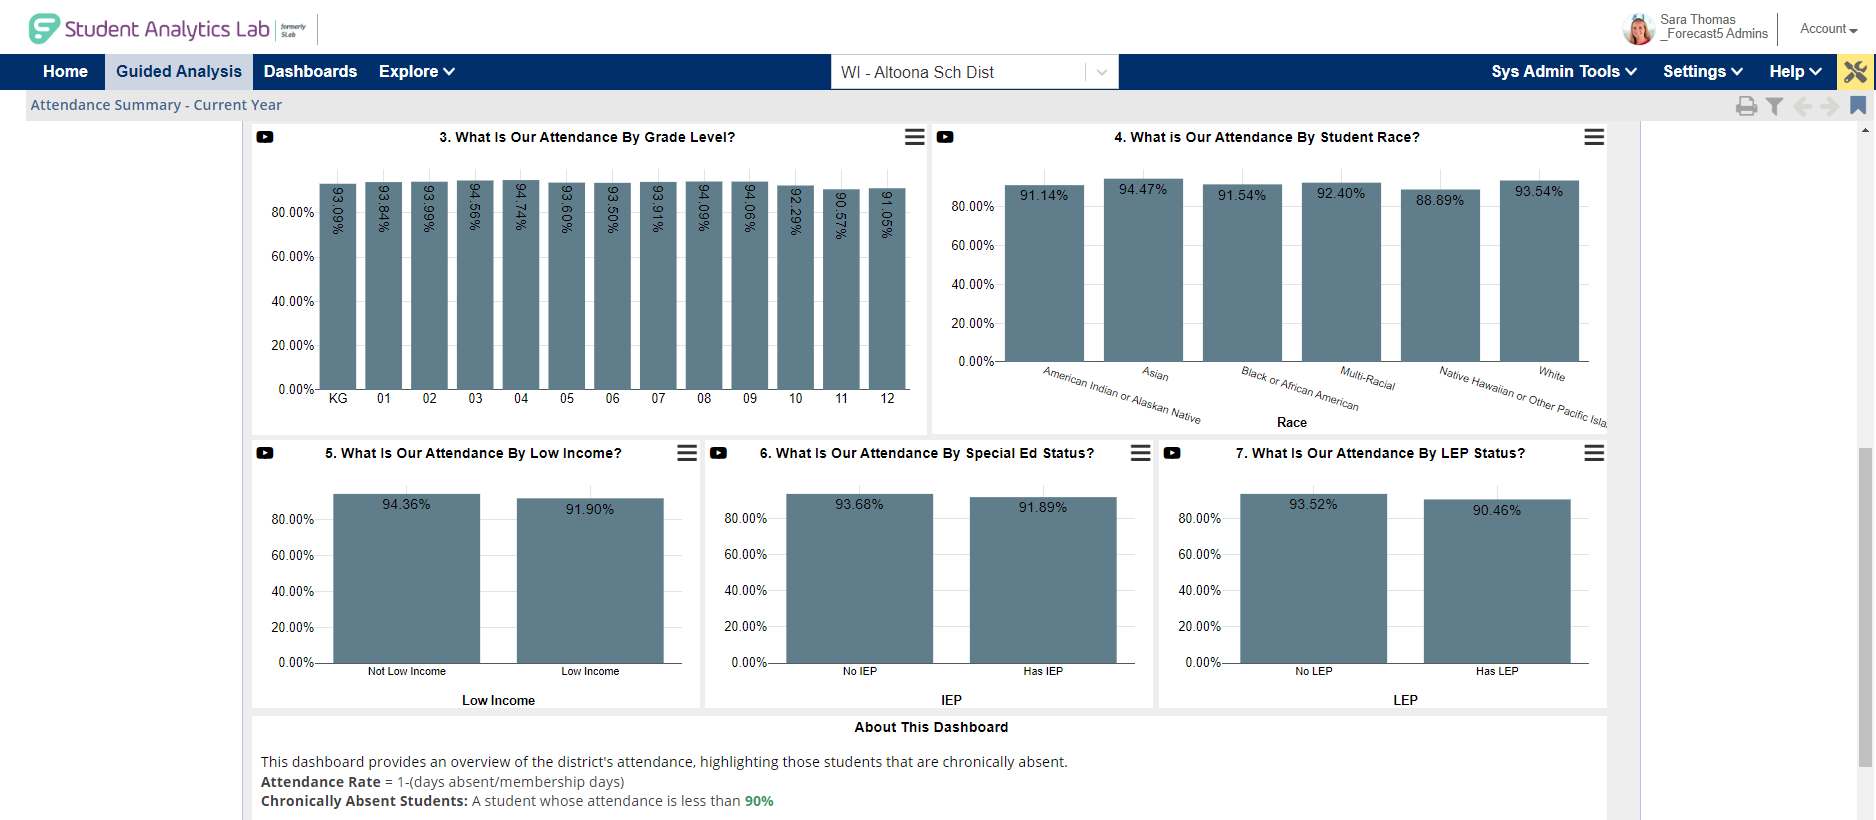
Sarah said that the ability to look at data at both a high level and an individual student level helps the district make programming decisions that ensure students don’t get overlooked and fall behind. “We can use our Redefining Ready indicators and Student Analytics to drill down to those groups, because on our strategic plan, we say ‘all students.’ We need to mean all. We can’t say, ‘Well, 88 percent is pretty good,’ and move on with it, because that 88 percent doesn’t represent all the kids that we teach. That’s a huge benefit to using student data analytics, because at the drop of a hat, we can drill down into whatever group we want to look at, depending on who’s around the table and what we’re trying to problem solve.”
“That’s a huge benefit to using student data analytics, because at the drop of a hat, we can drill down into whatever group we want to look at.”
That’s critical, Heidi said, because looking only at the district as a whole can mask student populations who are struggling. “We were mortified to learn that in a couple places in our district, zero percent of students with IEPs were meeting the proficiency benchmark. Zero. That’s a problem. But that was hidden. It was camouflaged when we were only looking at full population data.”
A Sense of Urgency
Besides being able to quickly pull together many different data points from multiple sources, Heidi said Frontline Analytics helps her and the district leadership make programming decisions. While principals might look at student- and grade-level data, Heidi looks at longitudinal data across the entire system to see whether the district is improving over time.
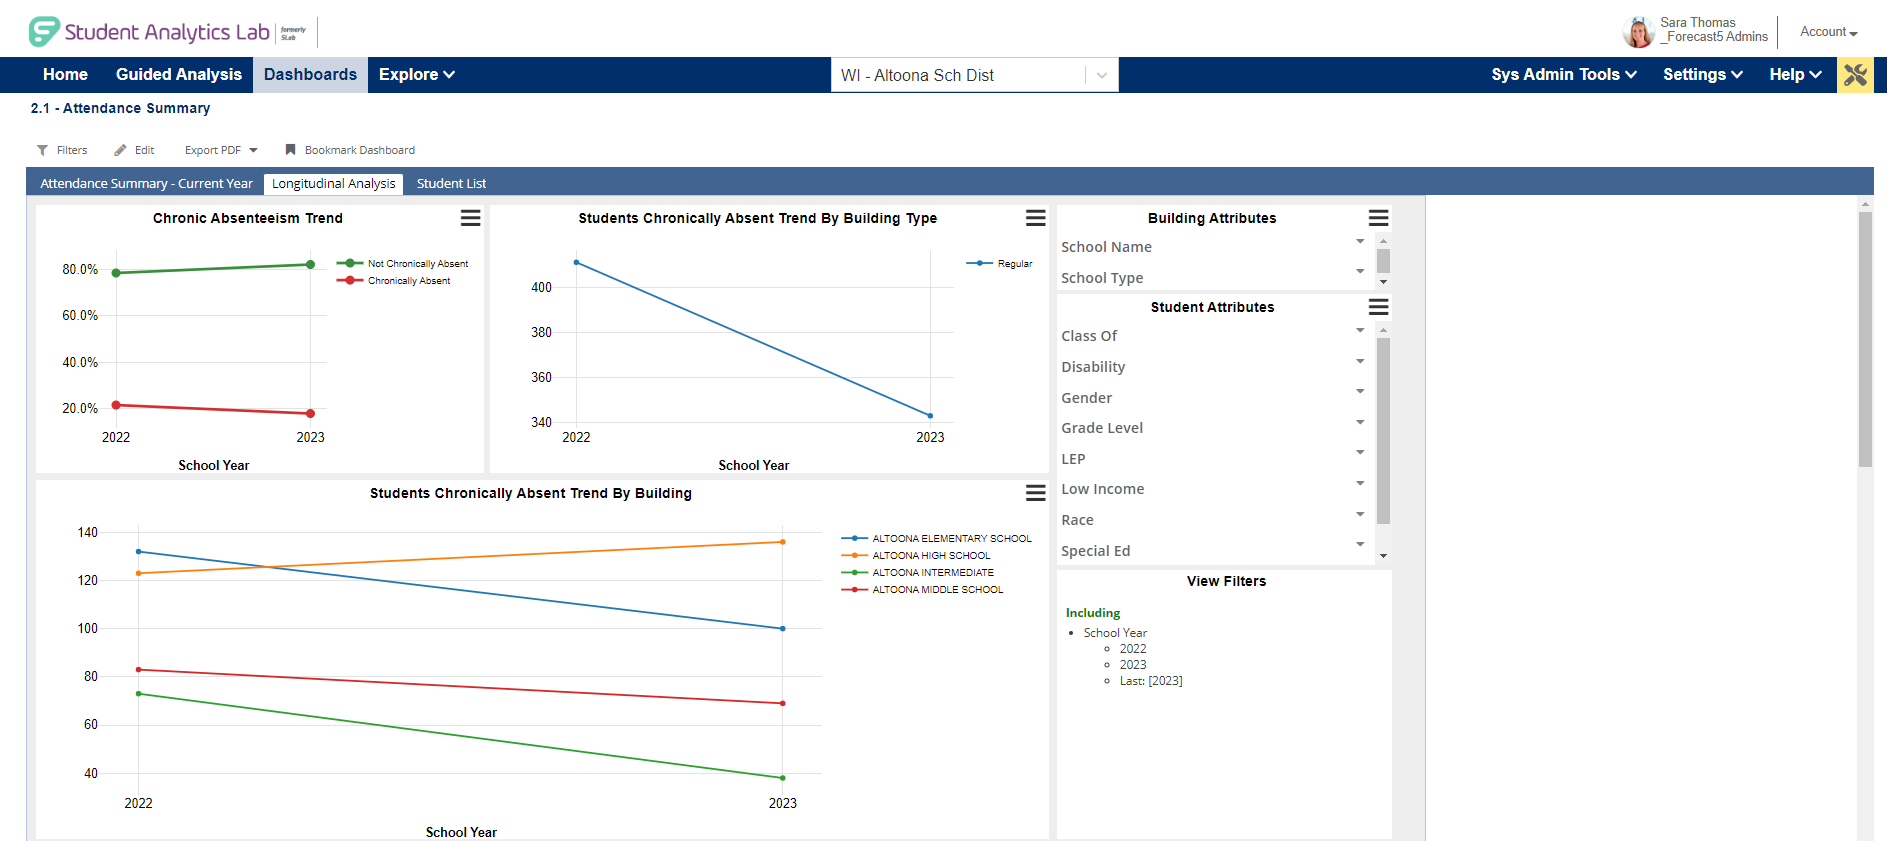
Three years ago, the district wasn’t improving — and Heidi and her team only realized it because they took a hard look at the data. “We had a reputation as a high-performing district, and our data did not show that. Once we started looking at the data, we realized we were on a downward slide and something had to change.”
Heidi said the administrative team was shocked when she shared the data with them. “Because the gaps were disguised by overall achievement, we all believed we were a high-performing district. But once you break down the data by specific schools, by specific grade levels, and by specific demographics, we aren’t a high-performing district. In fact, we have some really big problems here.”
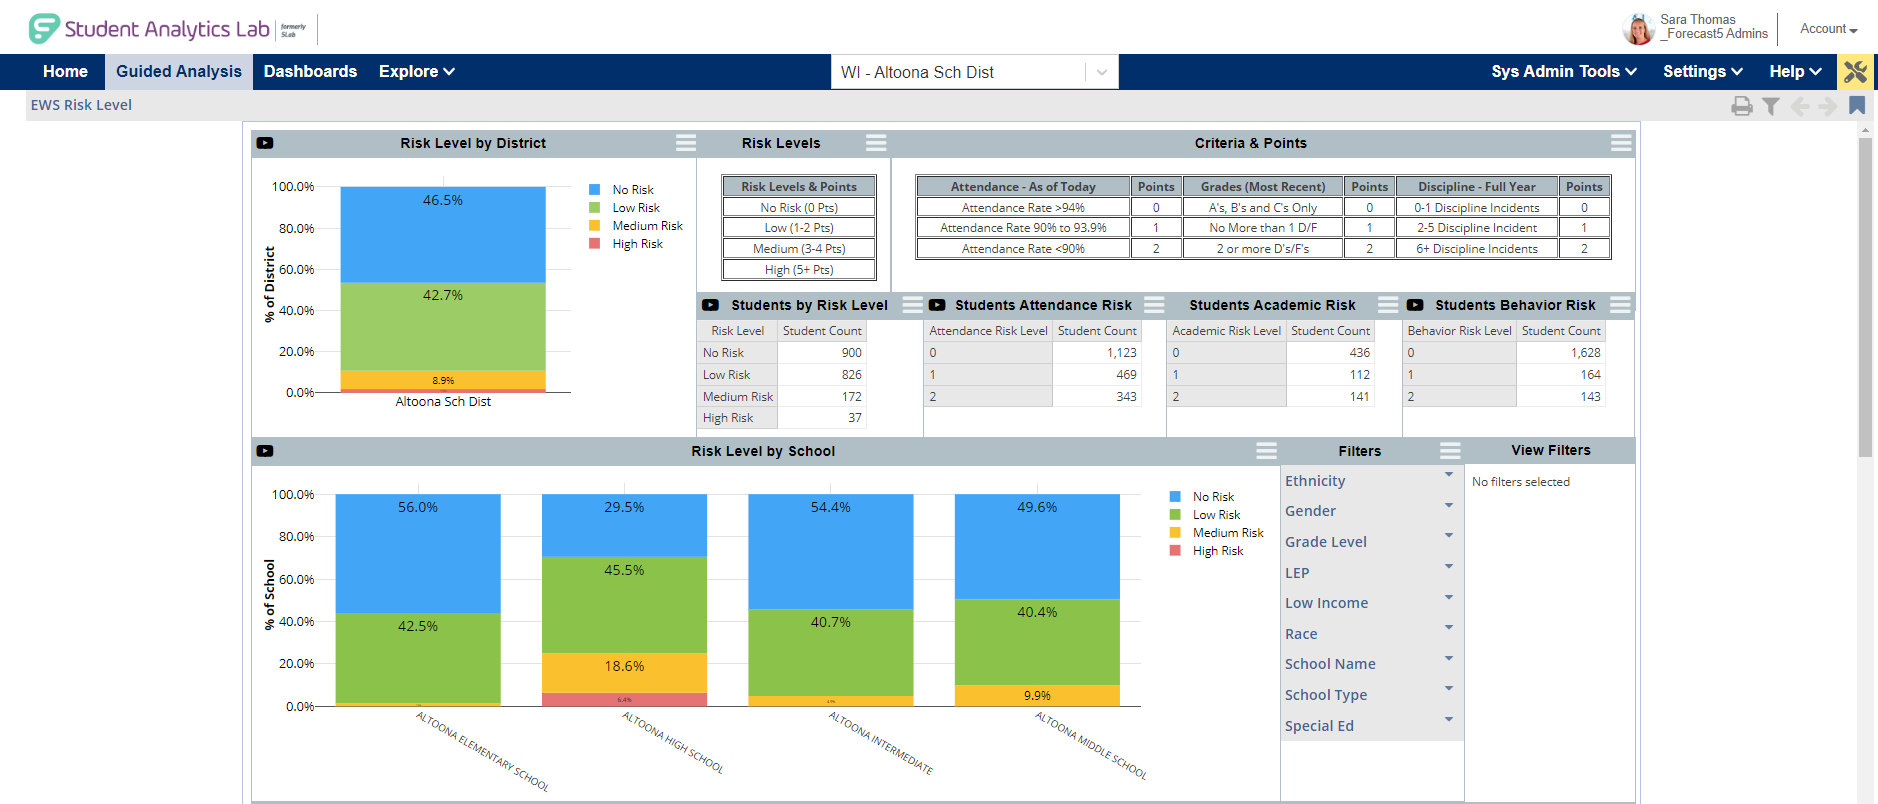
Plotting the data on visual graphs told the story clearly and helped to galvanize the team to action. “It helped define the need and create a sense of urgency,” said Heidi. “When I have a lot of line graphs and you can visibly see the gaps, and you can visibly see the gaps aren’t closing, as a matter of fact they’re getting bigger, that creates a sense of urgency in me.”
“It helped define the need and create a sense of urgency.”
Heidi presented the information to the staff, school board, administrative team, and community. She shared where the district stood at the time, where they wanted to be, and the steps they would take to get there. Typically, she said, a recovery like this takes five to seven years, but because they took quick action, they’re starting to see positive signs only three years later.
“We were on a five-year downward trend, and even though we’re just coming off of COVID where we’re expected to continue to go down, we already have recovery points of data because people are starting to see a need to change and starting to realize that if we continue on this downward trajectory, we’re not serving kids.”
Data Leads to Action
But ready access to data like this doesn’t move mountains if it just lives on a screen. “Data isn’t the solution,” said Heidi. “You use the data to help you identify a solution and have the courage to dig in.”
Heidi and Sarah are using the data they’re seeing in Frontline Analytics to make decisions for school programs and work with individual kids. It does require courage, but it’s what can spur meaningful change, and now Altoona School District is taking the meaningful steps needed to serve every student, and every group of students.
“When you get to the point where you’re comfortable having some real conversations about what your data is telling you and what you’re going to do about it, that’s when you’ll be able to make a difference for kids.”
Data-based Decision-support Software for Schools
See how Frontline Analytics can help your district make more strategic decisions by bringing your data together into easy-to-understand visual dashboards — and communicate your vision to your board, stakeholders, and community.