Redrawing School Boundary Lines
Case Study: How the School District of Lancaster formed a data-informed strategy to reconsider school boundaries in response to changing enrollment — and get buy-in from the community.
At a Glance:
- Location
- Lancaster, Pennsylvania
- K-12 Enrollment
- 10,089
- Facilities
- 18
- Staff
- 1,460
Frontline Solutions Used:
- Analytics
- Location Analytics
- Other Solutions
- Financial Planning Analytics
- Budget Management Analytics
- Comparative Analytics
- Student Analytics Lab
- Absence & Substitute Management
- Professional Learning Management
Needed: New Boundary Lines
People form emotional bonds with their schools. Kids spend so much time during their formative years in these buildings, with teachers and principals and bus drivers and cafeteria workers who invest in them, and families connect to the community. So, when a school district makes changes to which school a given student might attend, it’s important to get it right.
In 2018, the School District of Lancaster (SDoL) in Lancaster, Pennsylvania, knew the time had come to take a fresh look at boundary lines in the district. It had been 30 years since those lines had been revisited, and as the population changed, a boundary line study was necessary to move forward with new building plans. Drew Schenk, the Interim Director of Operations, said, “One thing we knew is we had class sizes getting out of balance, and we were starting to plan building renovations. We wanted to make sure we were building the appropriate size school buildings for our enrollment, not over-building or ultimately under-building.”
Several questions stood out: should they maintain the current boundary system? How would they balance class sizes? Could they offer neighborhood pre-K options? What about walkability? How about dual language access? Which elementary schools should feed into which middle schools?
At the time, the district began working with a firm to guide them through the process, help them ensure they had clean student-level data, collect community and stakeholder feedback, and make a recommendation to the Board of School Directors, which they did on March 10, 2020. Then, on March 13, two years of work came to a halt as the district shut down due to COVID.
The pandemic led to significant changes in the district. Student enrollment dropped by roughly 1,000 as some families switched to home school and cyber school, and others left the district’s geographic area altogether. The population of the district shifted somewhat from urban Lancaster City toward the more suburban Lancaster Township as people moved out of the city. Suddenly, the boundary line study that had been done was no longer relevant. The school district needed to re-analyze its data and come up with a new proposal.
Mapping Student Data
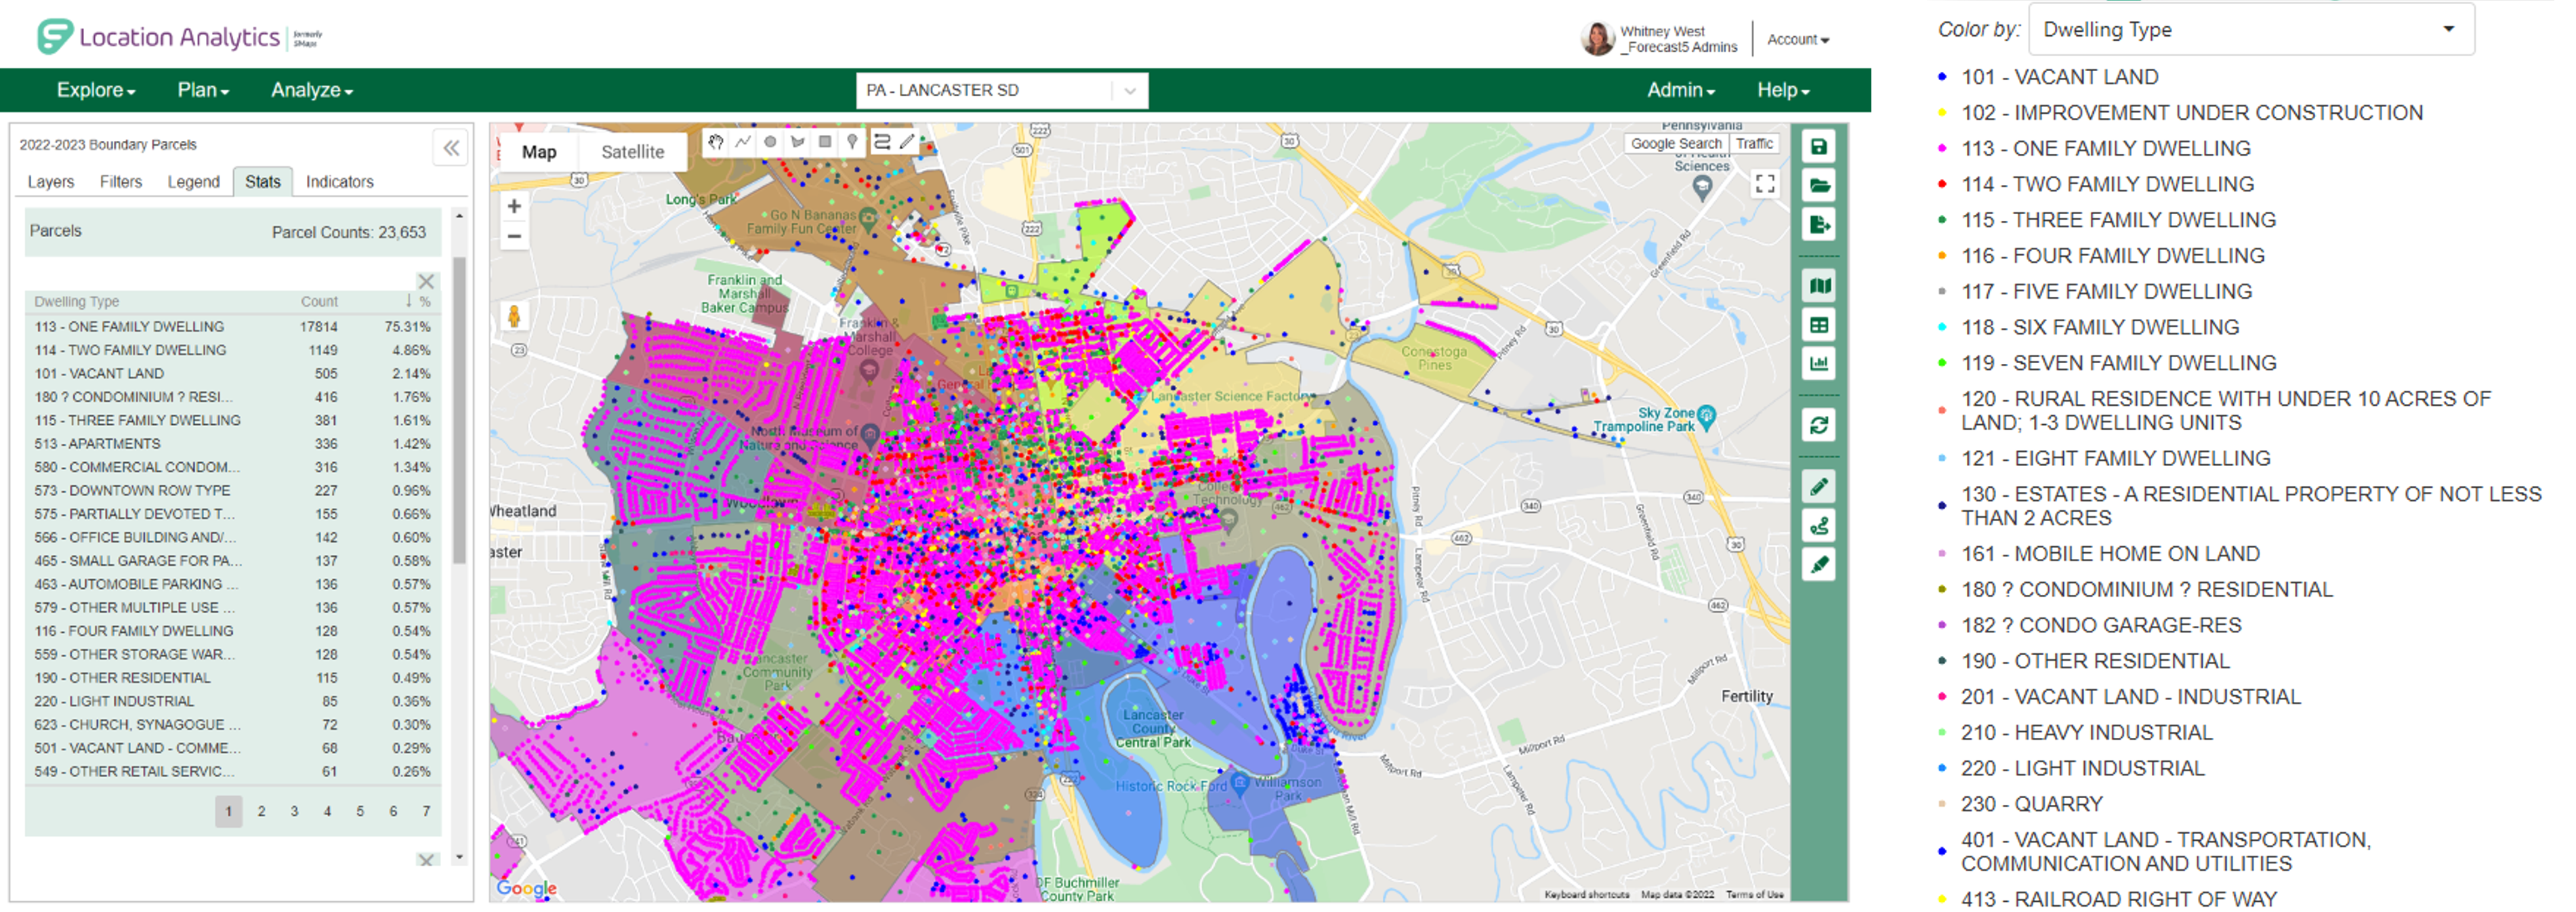
Rather than hire another outside firm, the team at SDoL began using Frontline’s Location Analytics (known at the time as 5Maps from Forecast5 Analytics) to visually map their student data.
“What you’re seeing is, as of today, our current school boundaries for the elementary and middle school level. And using this software, I’m able to get in there using day-old student data from our student information system and pull parcel data from county files to analyze what is going on in our district.”

Any data in the SIS and in the county files can be mapped. In this case, SDoL was able to visualize school building boundary lines and which students reside in each area. Better yet, Location Analytics made it easy to visualize student location by any criteria from their SIS and instantly apply filters.
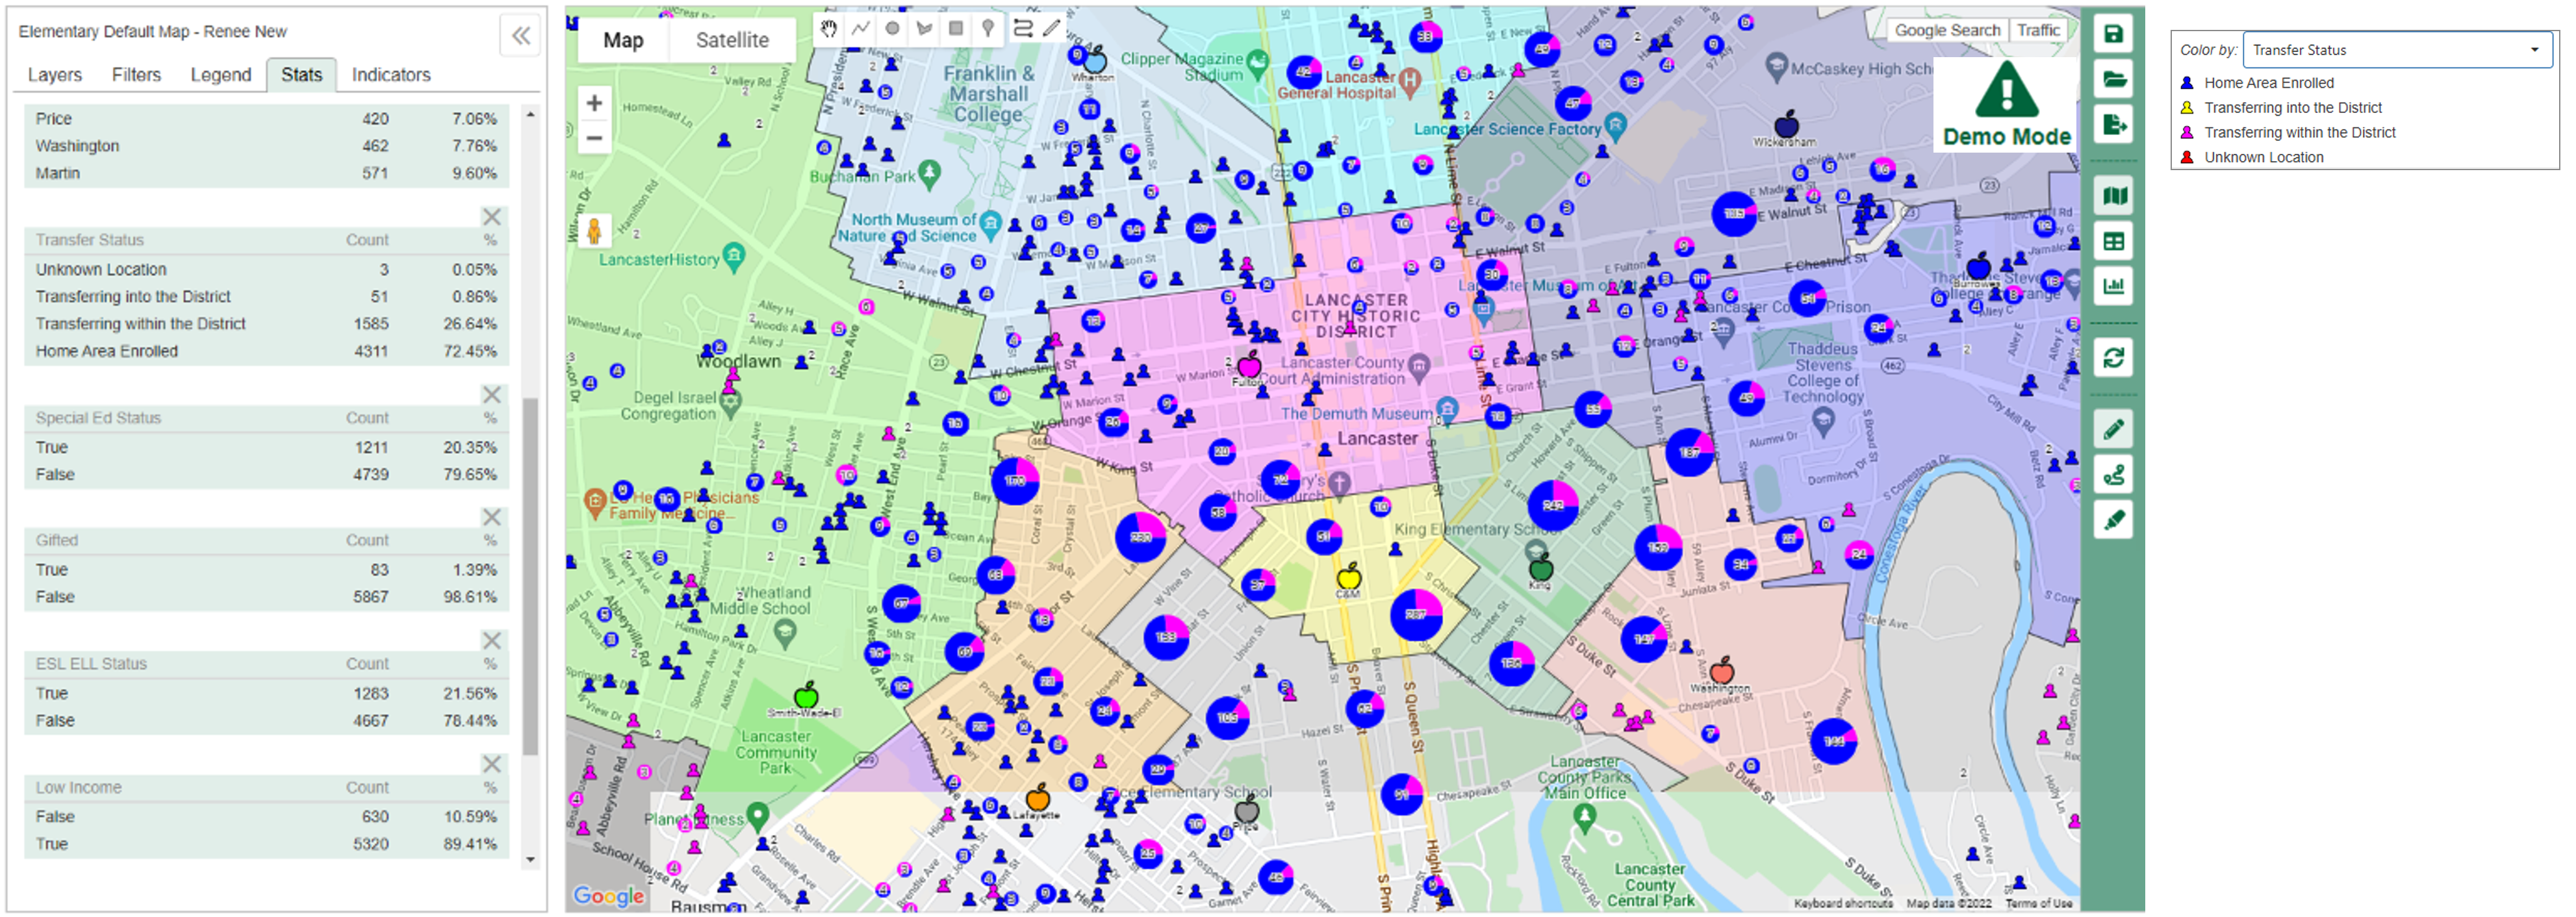
“There are other ways to color code by school building or by any identifier that you want to feed into Location Analytics from your SIS….You can see transfer status, special education status, gifted status. You can color code and filter and sort by any of these. One of the amazing things here in Location Analytics is as I’m drawing new boundaries, that stats panel on the left-hand side is updating basically in real time. There’s no more, ‘Let’s tweak a line, run a report, compare it to a prior report’ — you have it all at your fingertips as you’re doing this work.”

This made it possible to see where certain student populations resided, such as students who transferred into the district from other locations, or unhoused families who lived in surrounding districts but continued education at the School District of Lancaster under the McKinney-Vinto Act.
Somewhat alarming to Drew was the number of students who transferred within the district — those who attended a school building outside of where their address was zoned to, even when such a transfer was unnecessary.
Transportation Needs
Since SDoL is an urban district, most students walk to school. With a 1.5 mile walk zone at the elementary level and a 2 mile walk zone at the secondary level, Drew and his team could visualize a 1.5- or 2-mile radius around each school building, see which students live within each radius, and optimize how to balance class sizes while making sure as many students as possible were still able to walk to school.
The Value of Working with Their Own Data
In each of the above cases, looking at the right data in the right way made it possible for SDoL to see how different strategies would impact the community, and to make decisions accordingly. The wrong data — or incorrect assumptions — would lead to the wrong conclusions. Because the district knows their data better than anyone else, being able to work directly with that data enabled them to create a better plan. In addition, they were able to easily show principals and other community stakeholders the proposed plan and collect feedback.
Getting Community Buy-in
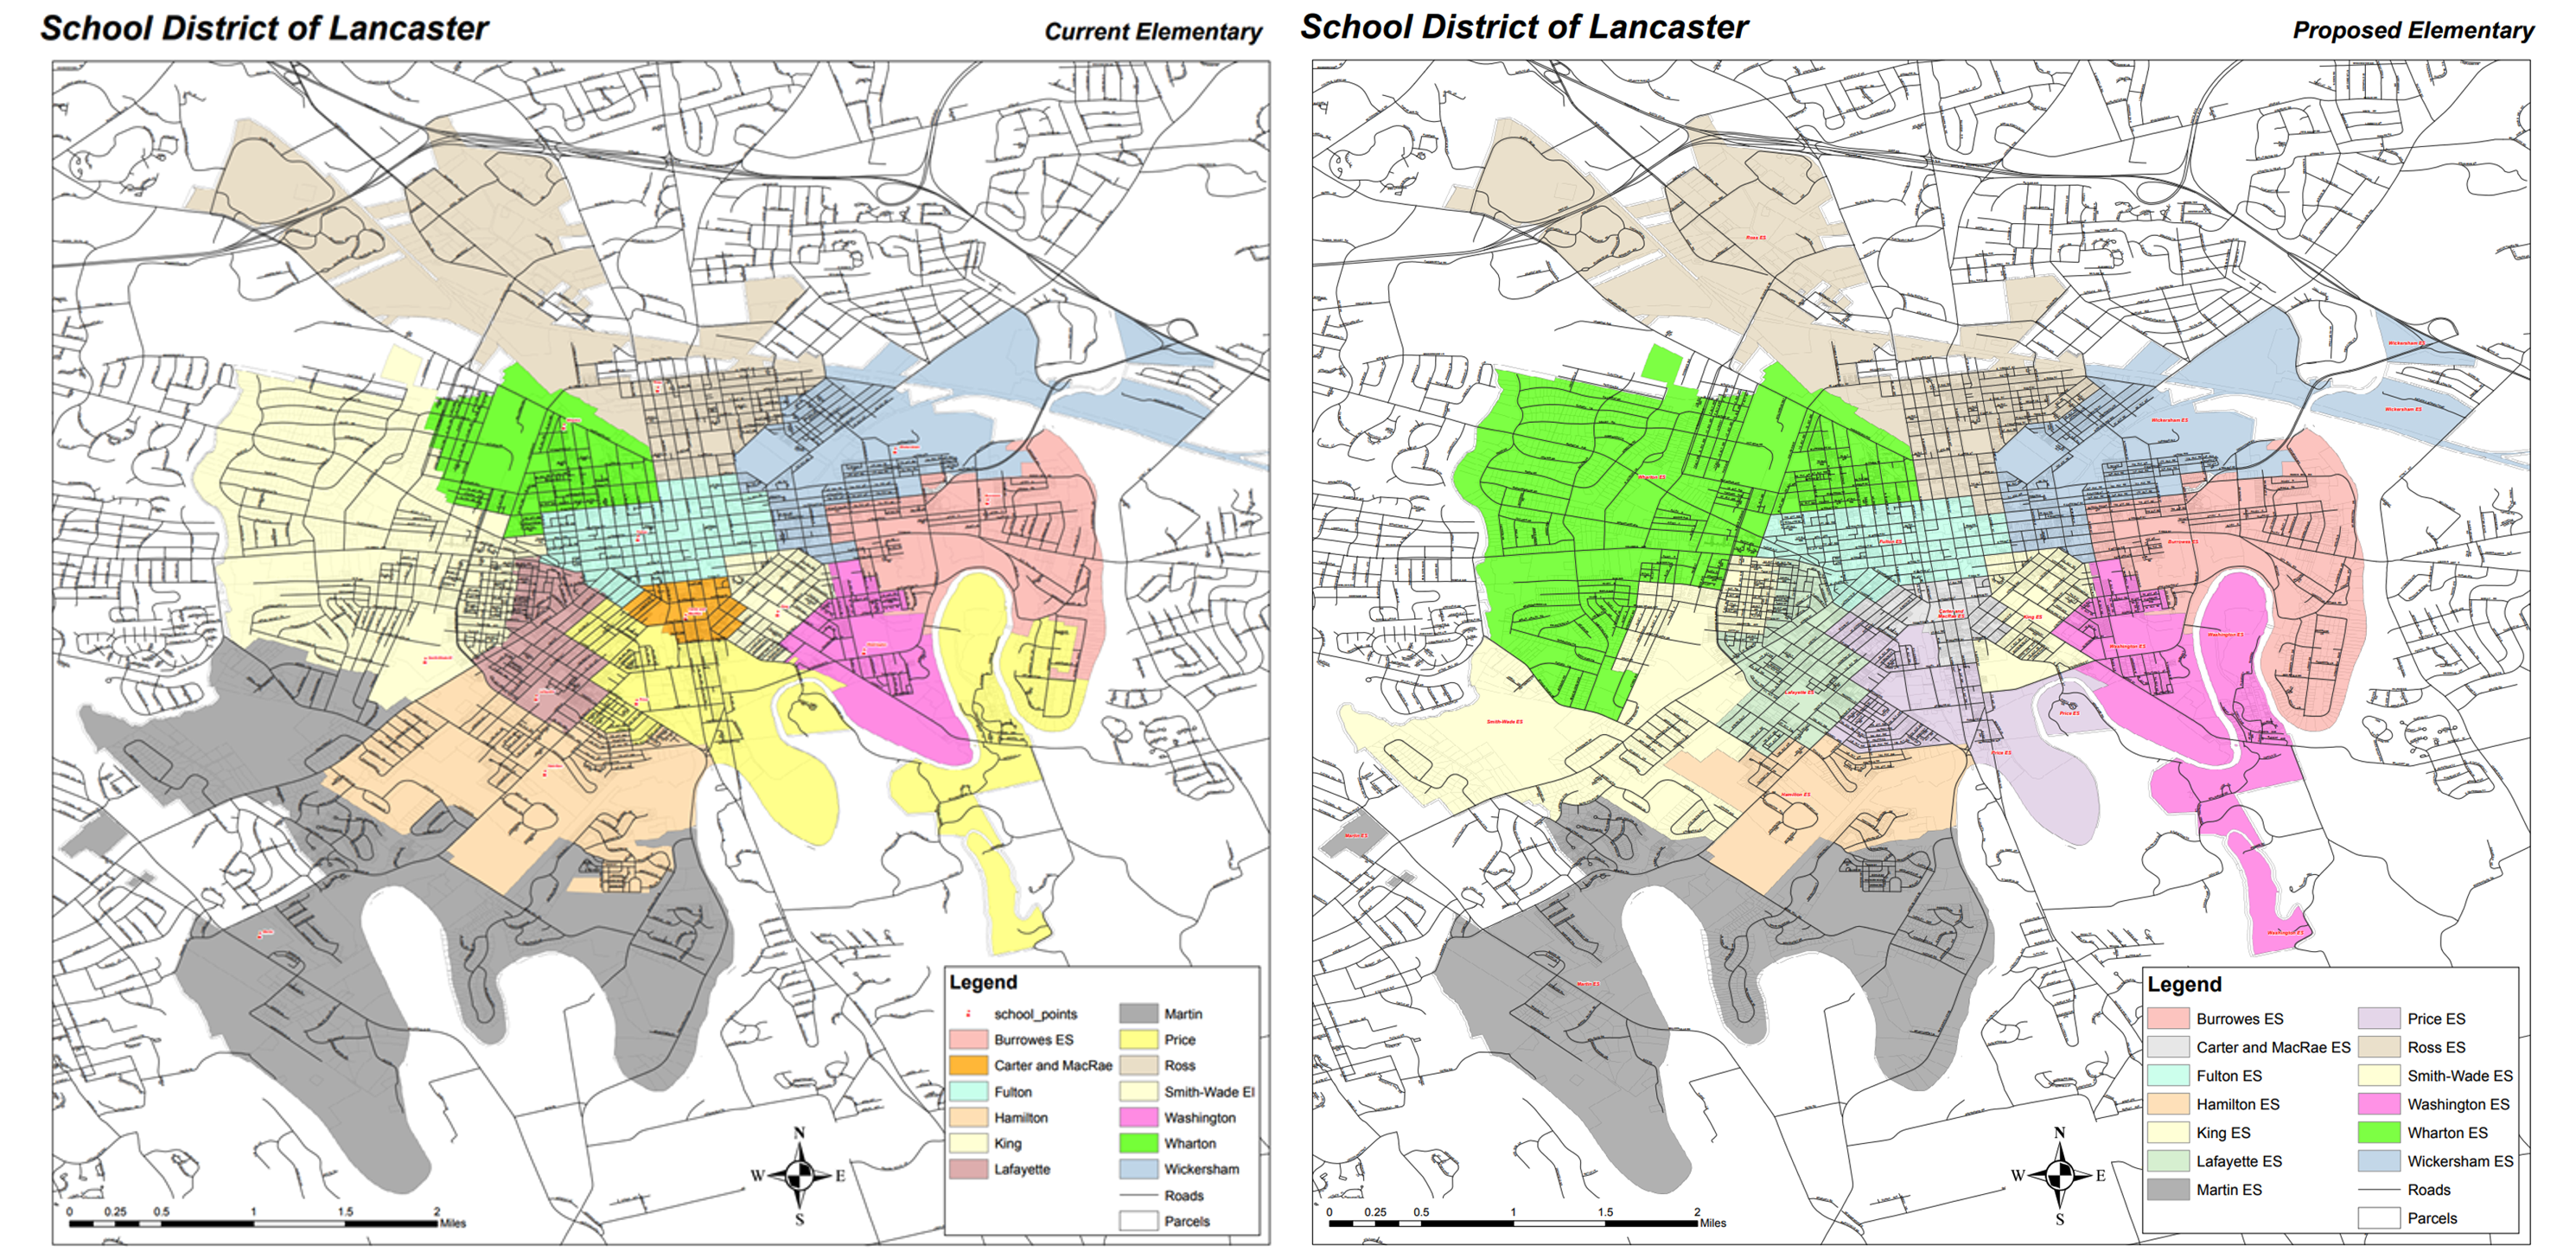
The plan involved significant boundary changes. One of those changes involved sunsetting a dual language immersion program at one elementary school and using the freed-up space to relieve overcapacity at other schools. Location Analytics was instrumental in getting community buy-in for the new plan.
“That particular neighborhood had a lot of opinions, as you could imagine — some very strong voices. And having Location Analytics was probably the most vital thing in making them feel heard and them understanding where we were coming from. We were actually able to bring their PTO president into the office, sit down with her for about two hours, and put on the map the boundaries that she had in her mind. She left with a better understanding of why we proposed specific boundaries, and specifically why her neighborhood’s request did not work, not only for the neighborhood, but looking at the district as a whole.”

One colleague in particular, Renee Ortiz, owned the data and knew the system quite well. “She was able to field and answer just about every community question and concern that came in,” Drew said.
Additionally, they considered rising 5th and 8th graders who under the new plan would not get to complete their final year in the building they had previously attended, and looked at the data to gauge the impact of allowing those students to remain in their current building for an additional year. The decision to grant continuation to these students in their current building was a valuable step to gain goodwill.
The result?
“Our Board unanimously approved these new boundaries at our April Board meeting to go into effect for the next school year.”
School Transition Planning
Any major transition like this requires significant coordination. The district formed three teams: one focused on communication, one on systems, and one on the student, staff, and family experience. Each team worked together to use the data reported out of Location Analytics.
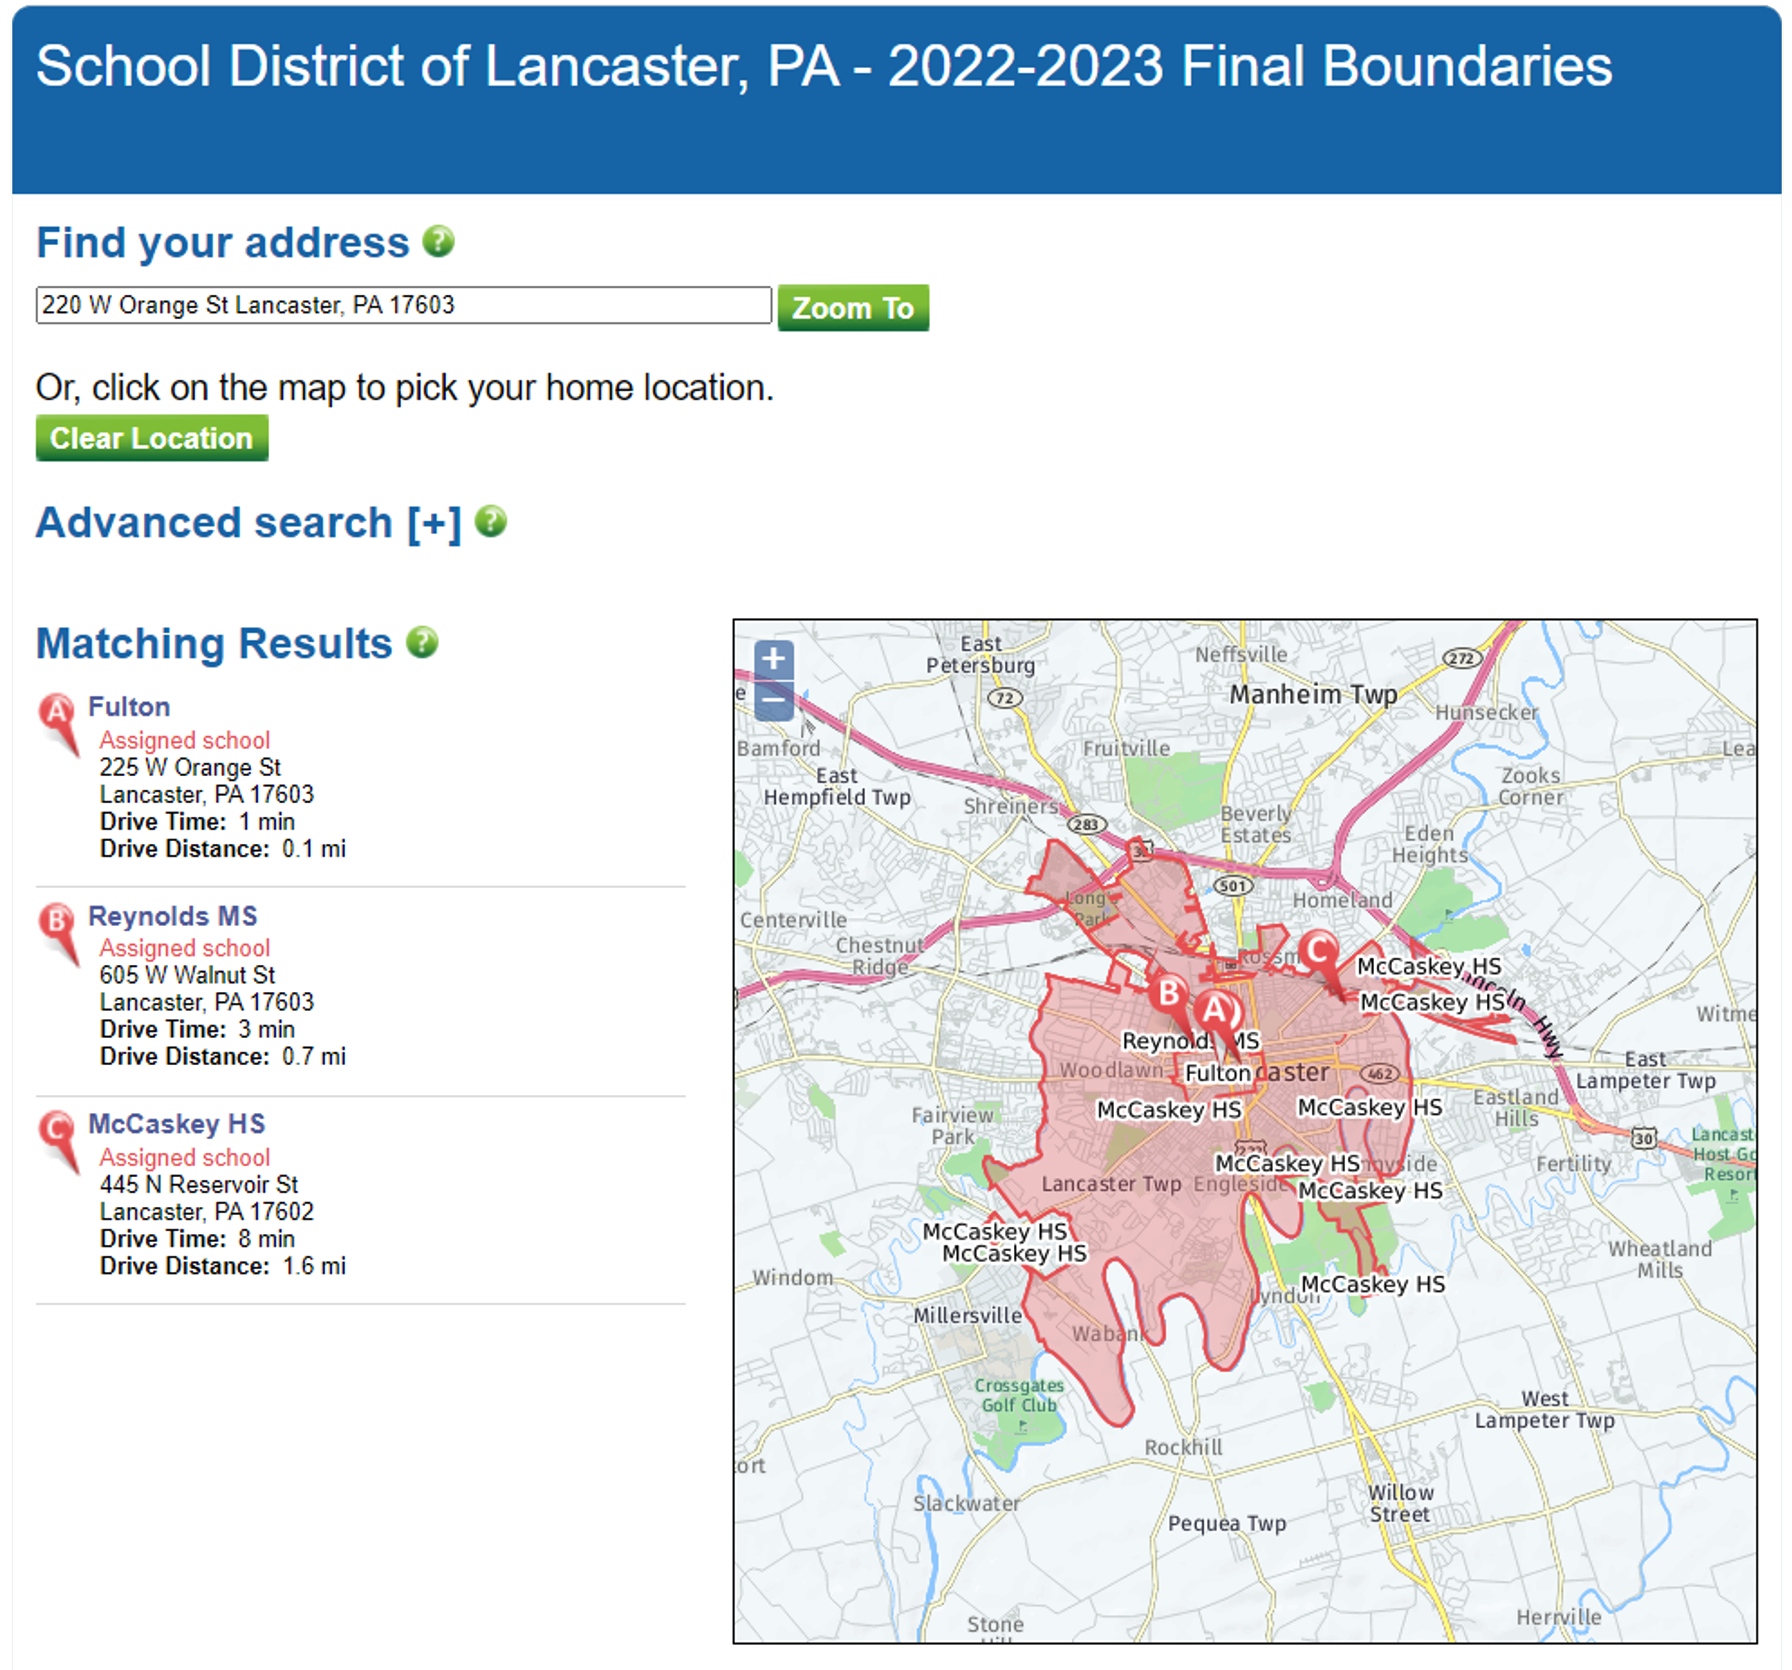
The district set up a web page where families could get answers to frequently asked questions as well as enter their address and see which school their children would attend the next school year. Local realtors also used this tool heavily; because MLS listings would not reflect the school boundary changes until July 1, this allowed realtors to show prospective homebuyers where their children would attend school.

SDoL crafted a robust plan to help students with the transition. They held days when students could ride the bus to their new school and receive a private tour and offered swag and t-shirts with their new school mascot. Families could attend Q&A sessions, and guidance counselors and resource specialists reached out to ensure families were well-prepared for the transition.
The district also sent out personalized letters to every family who may be impacted, saying “This change could affect you, and here’s how.” This level of personalization is what it took to get more involvement from parents and community members — much more so than simply sending out a postcard blast that most people ignored.
Continual Refinement
As the School District of Lancaster looks forward to the improvements the new boundary lines will bring, they are already planning to continue revising them as needed and have rewritten the Board policy that defines school placement.
“As part of that policy, it is now a Board directive that the School District of Lancaster revisit our boundaries every five years in the hopes that we don’t have to make a very drastic change in the future, we can make minor changes as we go and look at only impacting newly enrolled students, verses moving a student who has already built some roots in their school.”
With Location Analytics and the ability to quickly use their own data to visualize potential boundary scenarios, that process will be much easier.
Data-based Decision-support Software for Schools
See how Frontline Analytics can help your district make more strategic decisions by bringing your data together into easy-to-understand visual dashboards — and communicate your vision to your board, stakeholders, and community.