Delivering Actionable Data into the Hands of School Leaders Drives Success
Frontline Student Analytics is the key that changed McCaskey High School and turned it around.
School District of Lancaster at a Glance:
- Location
- Lancaster, Pennsylvania
- K-12 Enrollment
- 10,089
- Staff
- 1,622
“I knew that we couldn’t simply be satisfied at the end of the year saying, ‘Oh, here’s what happened.’ Looking every month or every quarter wasn’t enough.”
The School District of Lancaster (SDoL) takes pride in welcoming students from all over the world into its diverse community. Drawing on resources, experiences, expertise, and assets in the region, SDoL’s teachers make learning relevant and exciting as they prepare students for life in an interconnected world.
The Challenge:
The McCaskey leadership team wanted a way to collect meaningful data to help them address student needs in multiple categories.
The district’s high school, McCaskey, serves around 2,400 students. The staff is focused on goals of increasing literature scores and improving student attendance, but that’s just part of their plan. Determined to boost participation and achievement in advanced courses, especially for students of color, the leadership team wanted a way to collect meaningful data to help them address student needs in multiple categories. Relying on the student information system just didn’t provide enough information.
“I knew that we couldn’t simply be satisfied at the end of the year saying, ‘Oh, here’s what happened.’ Looking every month or every quarter wasn’t enough.”
The Solution:
McCaskey Principal Justin Reese teamed up with Jeremy Raff, Director of Data Analytics, to tackle the challenge. When the superintendent offered them an opportunity to try out Frontline Student Analytics (formerly 5Lab), they were eager to get started.
Realizing that Student Analytics could inform targeted feedback and support across the high school, Justin and Jeremy were excited about the opportunity to use student data in ways they had never even considered before.
“How can we know more and react more quickly to invest our time in improvement?”
The Results:
With the right tools, Justin and his team are able to solve problems in real time.
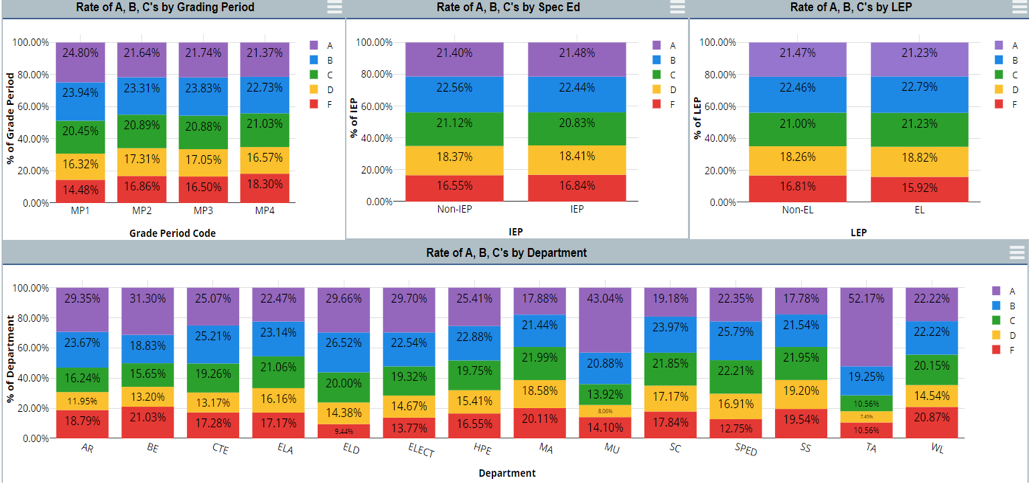
While exploring Student Analytics’ capacity to support decisions to help increase student performance, Justin has built a data-driven culture at the high school. The administrative team is learning how to drill deeper into specific subject areas and grade distribution by teacher. When they noticed that all the students in one teacher’s class had high grades, yet none had passed the final exam, it was a red flag that led to discussions on how to improve both instruction and student performance.
“As we built the program out, we realized we had more things we could add to it. We could tie in attendance by teacher, grades, individual students, or disciplinary trends to see where we needed to correct.”
Then they started to look at different metrics, like how students involved in extra-curricular activities performed academically compared to their peers or how individual assistant principals and teachers managed discipline, attendance, or other key areas.
Justin compares it to flying an airplane. As the pilot he can see his altitude, when he’s running out of gas, or where he needs to apply more or less pressure. With the right tools, Justin and his team are able to solve problems in real time.
“It almost became like a personal training coach for the high school because I know what our vital signs are day-to-day.”
Closing gaps in real time
A laser focus on student discipline and attendance resolves issues quickly. By isolating specific data, school leaders can address problems as soon as they surface. For example:
Problem: Out of 50 discipline referrals in a given time frame, 35 were in 9th grade, mostly in the cafeteria.
Solution: Increase adult supervision in cafeteria immediately.
Problem: 9th graders cutting classes during 7th or 8th period.
Solution: During those periods, administrators walk the halls and visit classrooms, making it harder for students to step out undetected.
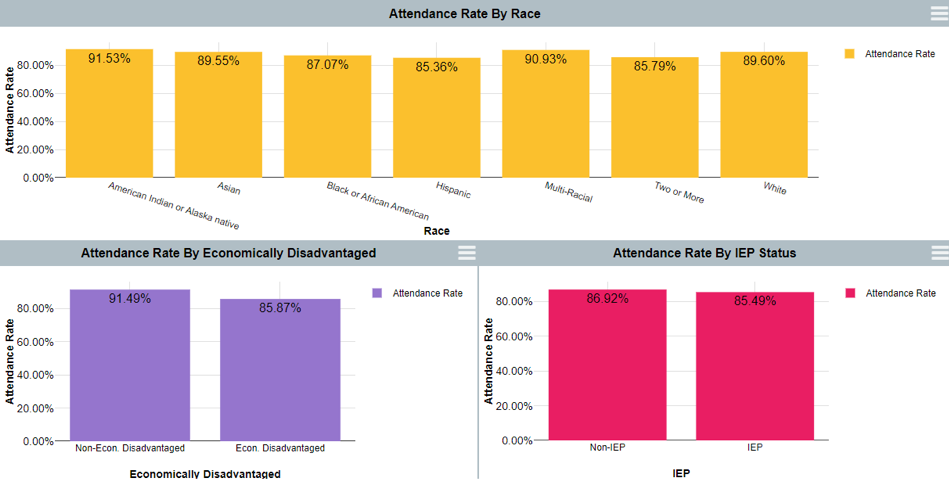
Problem: Rainy weather impacts attendance. Schoolwide attendance in grades 9-12 dips by 6% on a rainy day because students have to walk to school in the rain.
Solution: Share attendance data with the business office and superintendent and request bus tokens for students to use on rainy days.

All schools target learning gaps to try to improve student achievement. At McCaskey, Justin aims to fine-tune those targets. His to-do list includes:
- Tracking the efficacy of extra-curricular and extended-day tutoring programs.
- Seeing which students, by demographic, are enrolling in different courses, clubs, and athletics programs.
- Focusing on equity and access to locate areas than can be corrected.
- Identifying targets where investing more resources will support academic goals.
- Training teachers to make sure they provide feedback and score students appropriately.

Digging deeper and extending the reach
“You have the ability to satisfy your curiosity, to wonder about not just looking at race, but other variables. You can dissect it really well and see trends in a helpful way.”
McCaskey High School has served as the district’s main pilot for Student Analytics, and now Jeremy Raff is working on expanding it. Getting information into the hands of building leaders and helping them use it without having to dig through the student information system helps them gauge what they need to prioritize. Building and central office teams are already working on strategic goals and priorities laid out for the next couple of years.
While the high school is focused on goals like increasing enrollment in advanced courses for Black and Hispanic students, other coordinators and principals are learning to drill into their data. Armed with meaningful data, principals can advocate effectively for what they need and tap into district resources that will help them reach their goals.
Time spent is time saved
“It helps us be more data-driven instead of looking in the rearview, knowing what’s happening day to day.”
Even though it might seem that as a building principal Justin spends a lot of time analyzing data, the reality is that a quick daily check helps him pinpoint areas that need his attention. There is no comparison to the time it would take to pull up data from the student information system, download it on a spreadsheet, review the data, and decide what to do with it.
“In 10 or 15 minutes, I can get a quick pulse of what I’m looking for every day. I have the key metrics that I like to look at, but as I drill down on specific instances, it gives me a road map for what I want to work on.”
In the long term, using the interactive guided analysis pages in Student Analytics, the data shows where to start and shrinks what might seem like a hundred issues down to five or ten that can be addressed.
Having that instant access to data allows the school to tackle lingering learning gaps that occurred during the pandemic. Identifying deficiencies by student, subject, attendance, or any other relevant metric determines a course of action. The data also shows growth in advanced course enrollment, standardized test scores, and higher attendance rates. Compared to the previous year, students are passing more classes, and administrators are doing more teacher observations and coaching and increasing feedback to teachers.
“It’s incredible. I don’t just feel it, I also know it. We see quantifiable numbers.”
From good to great
The data provides proof of continuous improvement from one year to the next.
Before they started using Student Analytics, McCaskey was already a well-performing school. Yet as they learned more about the capabilities of the program, the data provides proof of continuous improvement from one year to the next. The difference between the 2020/2021 school year and the 2021/2022 year is impressive:
- Student attendance increased from 76% to 94%.
- Literature, math, and biology test scores have improved substantially.
- Enrollment grew from 2100 to over 2400.
- Over 1,000 teacher observations were completed.
- Teacher retention was at or near 100%.
“This tool changed our school. It’s helped us turn our school around. A key help, not just a help.”
When students are engaged in the classroom, good teaching is happening. Knowing where and why discipline and attendance issues occur means they can be fixed. Those factors alone have strengthened McCaskey’s climate and culture. The school is using real data to prepare students for life in an interconnected world by making learning relevant and exciting for all of them.
About Frontline Education
Frontline Education is a leading provider of school administration software, connecting solutions for student and special programs, business operations and human capital management with powerful analytics to empower educators. Frontline partners with school systems to deliver tools, data and insights that support greater efficiency and productivity, enabling school leaders to spend more time and resources executing strategies that drive educator effectiveness, student success and district excellence.
Frontline’s broad portfolio includes solutions for proactive recruiting and hiring, absence and time management, professional growth, student information systems, special education, special programs, Medicaid reimbursement, school health management, inventory control and asset management, payroll, benefits and financial management, and analytics solutions that help district leaders tap into their data to make more informed decisions for the benefit of their students and communities. Over 10,000 clients representing millions of educators, administrators and support personnel have partnered with Frontline Education in their efforts to develop the next generation of learners.
Frontline Education corporate headquarters are in Malvern, PA, with offices in Roseville, CA; Salinas, CA; Andover, MA; Walled Lake, MI; Rockville Centre, NY; Williamsville, NY; Brecksville, OH and Austin, TX.
Learn more at www.FrontlineEducation.com