

Troubled by substitute shortages and low fill rates? You’re not alone. These are challenges faced by many districts, and for good reason. Substitute management is no walk in the park: a lot of different elements go into maintaining and managing a healthy substitute pool.
To overcome the challenges associated with the substitute shortage, districts should dive into the story their data tells. Do you have a view of absence trends over time? What’s the depth of your substitute pool? How does absence lead time affect your fill rate? With visibility into the right absence and substitute trends, districts can gain a deeper understanding of their substitute program, and take actionable steps to ensure that every classroom is filled with a qualified sub.
In this installment of Talk Data to Me, we’ll be talking about trends in absence management data and substitute pools.

Handpicked Content:
Recruiting Subsitutes with Flexible Pay
Read the Case Study
National Trends in Staff Absences
The following chart displays the number of absences per organization (year over year) since 2020. The dark blue line is 2020 and the first two months were pre-COVID shutdowns.
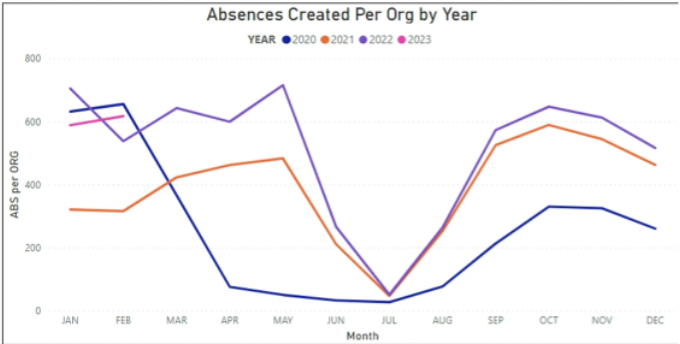

What does the data say?
- The average district in the country was creating about 600 absences per month.
- Immediately following the COVID lockdowns in March, that number plummeted to almost zero per month
- In the fall of 2020, the number started to climb up to about 350 per month and continued upwards through the spring of 2021, where it eclipsed 400 absences per month.
- The metric returns to a pre-COVID normal of about 600 absences per month in October of 2021 and that’s where we still sit today so far in 2023.
The takeaway![]()

National Trends in Fill Rate
As some districts may be experiencing, not as many of these absences are being filled by substitutes. Let’s take a look at what fill rate has looked like over the last few years. Keep in mind the dark blue line (the first two months of 2022) is a reference point.
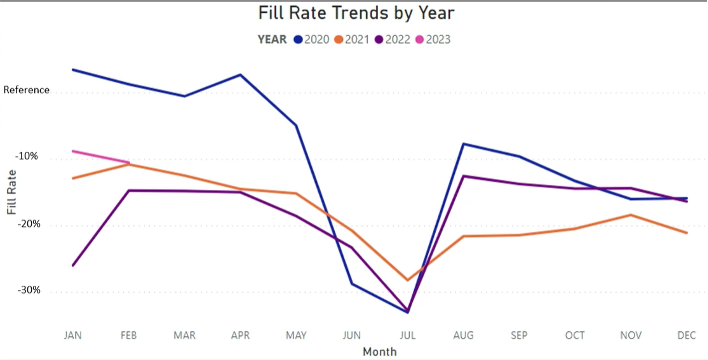

What does the data say?
- Absence fill rate actually increased in April of 2020 but then plummeted.
- Fill rate hovered around 20% below the reference line for the 2021 school year and the 2021-2022 school year was even lower.
- For the 2022-2023 school year, fill rate is up to around 15% below the reference line.
- Fill rate still appears to be climbing and is currently around 10% below the reference line. But that’s still a far cry from our pre-COVID level fill rates.
The takeaway![]()
National Trends in Substitute Pool Size
Why aren’t absence fill rate numbers back to normal? What’s behind this data? Let’s check out some substitute teacher metrics to paint the story. The following chart is the number of substitutes available to work in our system.
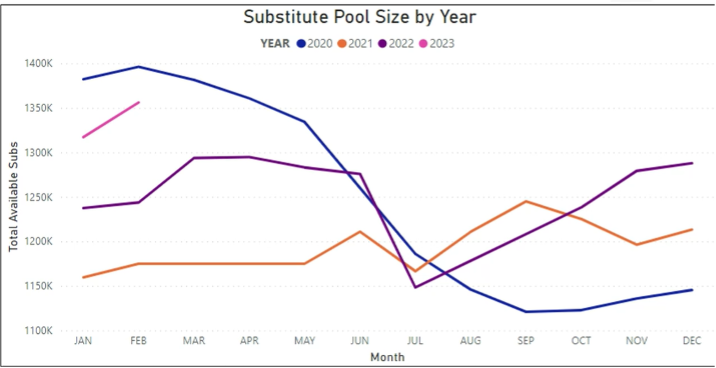

What does the data say?
- Before the pandemic, we were just about at 1.4 million substitute teachers.
- In late 2020, the number dropped to about 1.1 million before it started to steadily rise again.
- In 2021, it averaged about 1.2 million and it almost eclipsed 1.3 million in 2022.
- Earlier this year, it reached 1.35 million.
The takeaway![]()
National Trends in the % of Working Substitutes
While absence numbers are back to normal, fill rates are still down, but we have the same number of available substitutes. So how are fill rates down? Well, it’s because the number of substitutes that are available are not working at the same rate that they used to. This chart shows the proportion of available subs that actually worked at least one absence in each month over time.
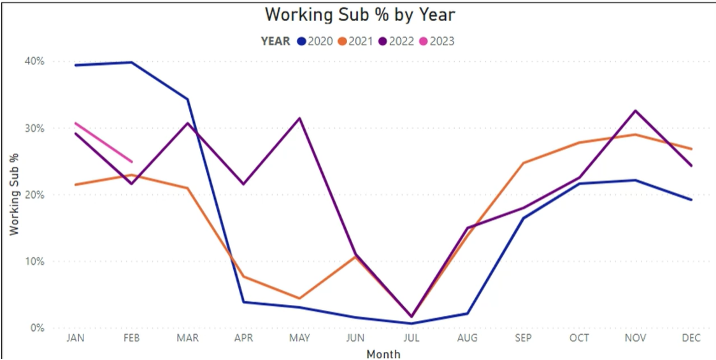

What does the data say?
- Prior to the pandemic, about 40% of available substitutes filled at least one absence per month.
- This metric has jumped all over the place in the last few years, but it hardly jumped over 30% in any given month, which is about where we currently sit.
The takeaway![]()
Trends in District-specific Fill Rates
Sometimes it’s hard to use data to take action in your district if you don’t know your own unique data. Not all districts are the same and not all data trends are the same. Let’s look at the fill rate trends in districts across the country. Below is a histogram of the number of districts nationwide by their current year substitute fill rate.
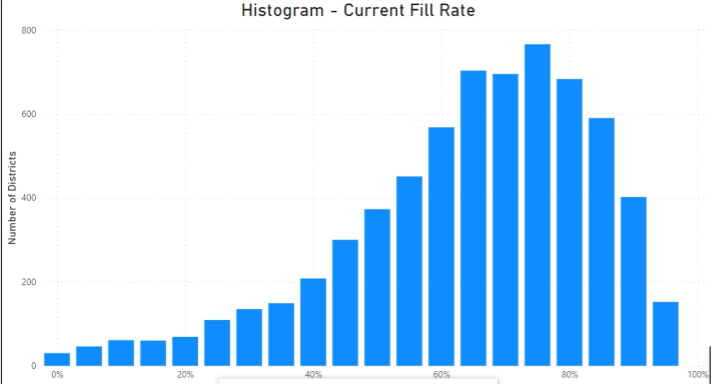

What does the data say?
- Most districts have fill rates between 60 and 90%
- Some districts have fill rates lower than that. Others have fill rates even higher.
The takeaway![]()
Ready to dive into your district’s absence and substitute data?
Understand your district’s staff absences with Human Capital Analytics
Recommended Resources:
Clocking Out of Timecard Misery: How Grayson County Public Schools found a better way to keep track of employee time, avoid errors, and confidently reclaim time for administrators, teachers, and staff.
How to Solve Shortages and Increase Substitute Effectiveness: Why do so many schools struggle to maintain effective substitute programs? Why do low fill rates and substitute shortages plague administrators across the country?
Accessing the Health of Substitute Teacher Pools by State: Many different factors can impact the size of a district’s active sub pool, including locality and the effort and focus that organizations put into attracting substitutes.
The Substitute Teacher Shortage: If there was one singular cause for the lack of substitute teachers, it would be simple to come up with a one-size-fits-all solution. Unfortunately, that’s not the case. So, what’s behind the shortage?