Report: Special Education Classification Rates Across U.S.
Special Education By Jo Ann Hanrahan, on 9/20/2017
By 2014-15 the number of children served under IDEA was 6.6 million or 13% of total public school enrollment. When looking at this data, districts, schools and educators must consider equity in education and the appropriateness of the classification of special needs students in and across states.
The Every Student Succeeds Act (ESSA) says each state is responsible for achieving equity for its special needs students. This means that family income, race, ethnicity, English Language Learners’ proficiency and disability status should no longer be predictors of a student’s educational potential. Equity is ensuring all students receive the resources they need to be successful, such as rigorous teachers, up-to-date instructional materials and more.
But with the significant flexibility allowed by IDEA in determining methods used to identify and classify special education students, how does classification from state to state look across the U.S., and do educators and administrators agree with the classification landscape in their local districts?
A recent Frontline Research & Learning Institute report, Crossing the Line: Exploring Equity in Special Education Across the United States, explores this question in depth.
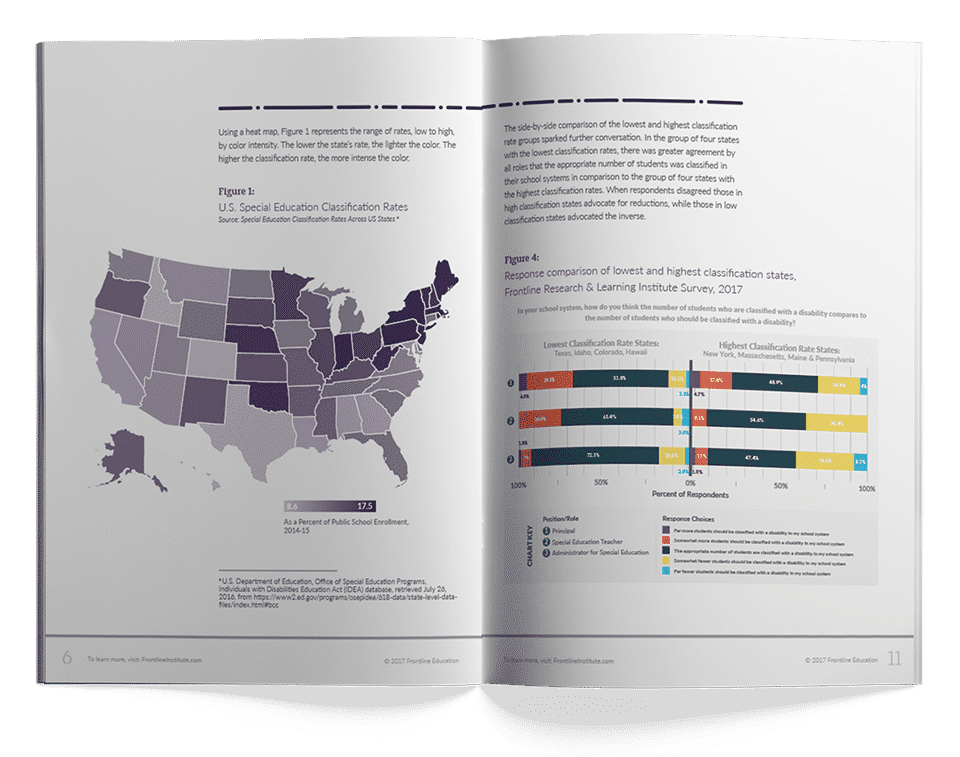
Classification Rates by Region and State
The Institute report notes that the highest classification percentages are clustered in four northeast states with 17.8% in New York followed by 17.6% in Massachusetts, 17.5% in Maine and 17.1% in Pennsylvania. States on the lower spectrum were scattered across the country with Texas at 8.6% followed by Idaho at 9.8%, Colorado at 10.4% and Hawaii at 10.5%.
Additional Resources
In a recent podcast, two education leaders discuss the root causes and ways to address the special ed teacher shortage.
Educators React to Their Local Classification Rates
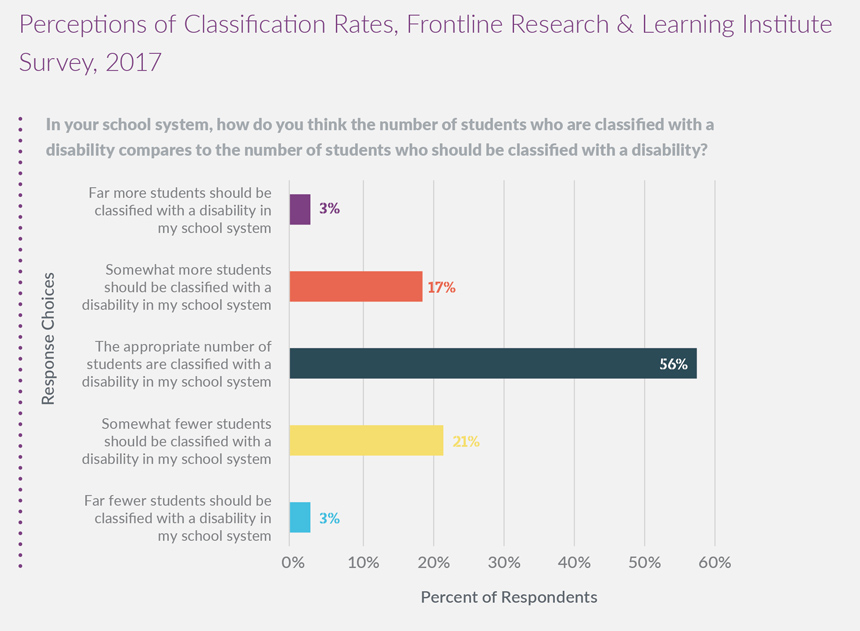
The Institute surveyed 3,000+ administrators, educators and related service providers to see how they felt about the classification rates in their local districts. Despite the fact that classification rates vary greatly across states, the majority of nationwide respondents (56%) believe that the appropriate number of students are classified in their local system.
Source: Frontline Research & Learning Institute. (2017). Crossing the Line: Exploring Equity in Special Education Across the United States.
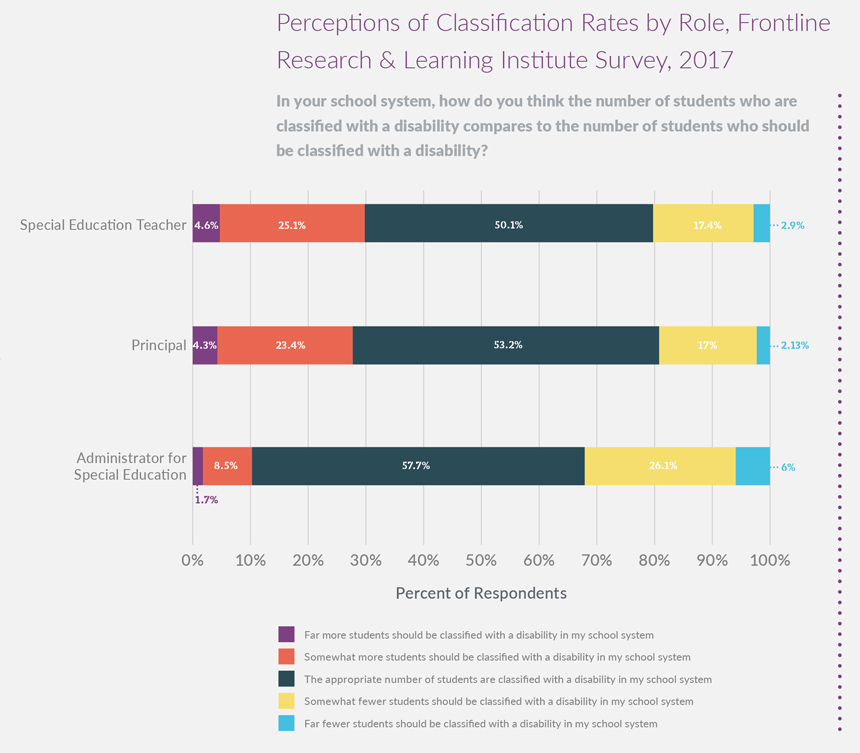
Results vary a bit when breaking them down by role. While special educators and principals reported feeling that more students should be classified than currently are, administrators and directors of special education felt that fewer students should be classified.
You can see how perceptions break down by these job categories and how they compare to the national statistics in the full report.
Source: Frontline Research & Learning Institute. (2017). Crossing the Line: Exploring Equity in Special Education Across the United States.
What About Your School System?
How do you think the number of students who are classified with a disability compares to the number of students who should be classified with a disability in your school system? And to take it a step further — what measures currently in place in your organization are working well to identify and support students with special needs?
Learn more about state-specific classification trends, equity and equality in the full report.
References 1. Frontline Research & Learning Institute. (2017). Crossing the Line: Exploring Equity in Special Education Across the United States. Malvern, PA. Retrieved from https://www.frontlineinstitute.com/reports/special-ed-report/.
Jo Ann Hanrahan
Jo Ann Hanrahan has over 20 years of experience in K-12 education serving students, teachers, district and state education leaders. She started her career as a classroom teacher and then transitioned into administrative roles in the areas of professional learning, teacher (alternative) certification, curriculum, assessment, & instruction, and educator effectiveness. With a Master of Arts in Education and decades of diverse experiences, Jo Ann is currently pursuing her Ph.D. and serves Frontline Education as the Director of Research & Data Analysis.